Research of the city’s digital images and location data
Supervisor: Yannis Skarpelos
Abstract
The widespread presence of social media, playing a major role in everyday life of citizens, combined with the use of mobile devices as photography equipment, have created a constant flow of creation and direct distribution of digital photographs.
This thesis examines the digital photo imprint of a specific area in the center of Athens during the year 2019, aiming to analyze the relation of the city and its citizens with the photos that are posted on social media.
Through these photos, is attempted a research of the digital image of the city – a “city of data”. The analyzed data volume is such that they can easily be labelled as Big Visual Data, leading to an exploratory research and analysis, implementing usual statistical analysis methodology as well as methods of analyzing Big Data like computer vision and machine learning.
The research completes by creating data visualizations, which provide a summarized but representative view of the photos, of the city locations and of the lives of those who live, work or visit Athens.
Keywords:social media, photographs, Athens, city of data, big data, big visual data, data visualizations
A few words about this website
During this research, over 120k photos were gathered from Instagram. They are photos taken throughout 2019 in 365 different locations near Monastiraki Square (mainly on Ermou Street) and near the monument of Acropolis.
Presented here, is a part of the research and analysis done for the purpose of the thesis.
Specifically, you can view visualizations that were created based on digital color analysis of the photographs, as well as grouping them using machine learning.
Through computer vision and machine learning, 10 main categories were identified, distributing the photographs among them based on the subject presented.
Color palettes were created by analyzing the colors of each photo, using an algorithm that finds the dominant colors of each photo and the ratio between them. These were then used to create color palettes of each category and location.
Finally, color histograms were created, based on the color palettes of the photographs per category or location.
The locations shown are those having over 120 photos.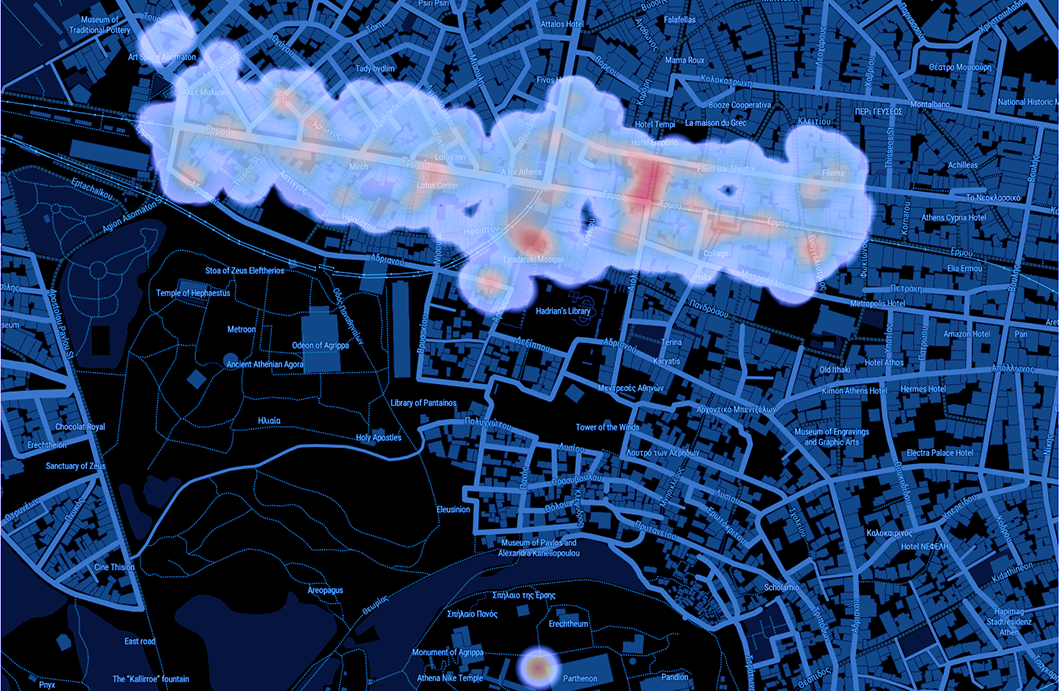
Geographic Heat map of locations and photo volume